Financial Analysis of Startups

The complete project can be found at: Financial Analysis of Startups
Introduction
The profit earned by a company over a given period depends on several factors such as costs and investments in administrative sectors, marketing, research and development, etc. The task of predicting profit is important for goal setting. These goals become strategic guidelines for the company’s continuous growth. For fast-growing companies, such as startups, knowing these forecasts becomes more than important—it’s essential for the company’s survival.
The database was obtained from: https://raw.githubusercontent.com/amankharwal/Website-data/master/Startups.csv
Keywords: data prediction, data modeling, Linear Regression, Bayesian Regression, Clustering, K-means, Cross-validation, Market segmentation.
Importing Libraries
import pandas as pd
import numpy as np
import seaborn as sns
import matplotlib.pyplot as plt
import warnings
from sklearn.metrics import  mean_absolute_error
from sklearn.preprocessing import StandardScaler, LabelEncoder
from sklearn.linear_model import BayesianRidge, LinearRegression
from sklearn.model_selection import train_test_split,cross_val_score
from sklearn.cluster import KMeans
warnings.filterwarnings('ignore')
Initial Database Analysis
dados.info()
<class 'pandas.core.frame.DataFrame'>
RangeIndex: 50 entries, 0 to 49
Data columns (total 5 columns):
 #   Column           Non-Null Count  Dtype
---  ------           --------------  -----
 0   R&D Spend        50 non-null     float64
 1   Administration   50 non-null     float64
 2   Marketing Spend  50 non-null     float64
 3   State            50 non-null     object
 4   Profit           50 non-null     float64
dtypes: float64(4), object(1)
memory usage: 2.1+ KB
The database has no null data.
The columns present in the DataFrame are:
 Index(['R&D Spend', 'Administration', 'Marketing Spend', 'State', 'Profit'], dtype='object')
Exploratory Data Analysis (EDA)
Which states are present in the dataset?
States listed in dataset: ['New York' 'California' 'Florida']

Number of companies per state listed in dataset:
New York      17
California    17
Florida       16
Name: State, dtype: int64
Basic dataset statistics:
dados.describe()
All variables have a direct correlation with profit.
sns.pairplot(dados)
The variables with the greatest influence on startup profit are:
- R&D Spend (research and development expenses)
- Marketing Spend (marketing expenses)
The highest monetary return for startups comes from investments in R&D. Administration expenses have little relationship with startup profit.
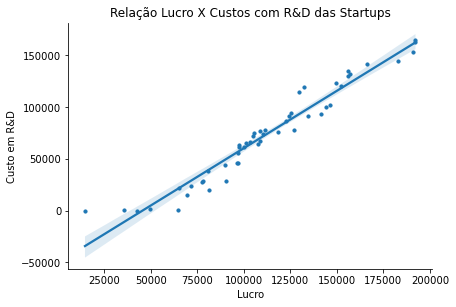
From the correlation graph, it’s possible to see that the relationship between profit and R&D costs in startups is almost linear and well-behaved. This relationship can be better seen in the graph displayed below. Unlike marketing costs, which also have a high correlation with profit but don’t show a well-behaved graph.
ax = sns.lmplot(x="Profit", y="R&D Spend",data=dados,height=5,scatter_kws={"s": 10, "alpha": 1})
ax.figure.set_size_inches(7,4)
ax.set(title='Relationship Profit X R&D Costs of Startups',xlabel='Profit',ylabel='R&D Cost')
Analyzing Profit by State
ax = sns.barplot(data=dados,x='State',y='Profit')
ax.figure.set_size_inches(10,5)
ax.set(title="Distribution of Profits by State",ylabel="Profit",xlabel='State')
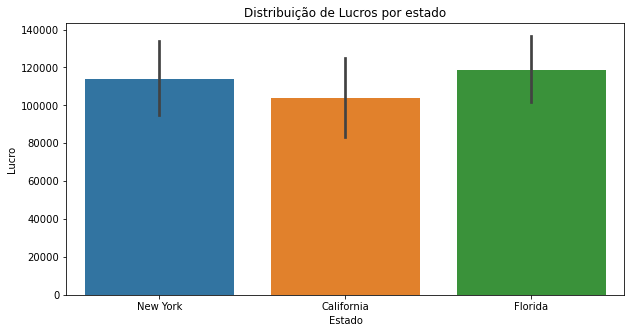
On average, startups in the three states have similar profits.
Predictive Modeling
Linear Regression
Using Linear Regression to predict startup profits based on R&D, Administration, and Marketing expenses.
from sklearn.linear_model import LinearRegression
from sklearn.model_selection import train_test_split
from sklearn.metrics import mean_absolute_error, r2_score

# Preparing data
X = dados[['R&D Spend', 'Administration', 'Marketing Spend']]
y = dados['Profit']

# Splitting into training and test sets
X_train, X_test, y_train, y_test = train_test_split(X, y, test_size=0.2, random_state=42)

# Training the model
model = LinearRegression()
model.fit(X_train, y_train)

# Predictions
y_pred = model.predict(X_test)

# Evaluation
mae = mean_absolute_error(y_test, y_pred)
r2 = r2_score(y_test, y_pred)

print(f"Mean Absolute Error: {mae}")
print(f"R² Score: {r2}")
Bayesian Regression
Applying Bayesian Regression for more robust predictions.
from sklearn.linear_model import BayesianRidge

# Training Bayesian model
bayesian_model = BayesianRidge()
bayesian_model.fit(X_train, y_train)

# Predictions
y_pred_bayesian = bayesian_model.predict(X_test)

# Evaluation
mae_bayesian = mean_absolute_error(y_test, y_pred_bayesian)
r2_bayesian = r2_score(y_test, y_pred_bayesian)

print(f"Bayesian MAE: {mae_bayesian}")
print(f"Bayesian R² Score: {r2_bayesian}")
Market Segmentation with K-Means
Applying clustering to identify different startup profiles.
from sklearn.cluster import KMeans
from sklearn.preprocessing import StandardScaler

# Normalizing data
scaler = StandardScaler()
X_scaled = scaler.fit_transform(X)

# K-Means
kmeans = KMeans(n_clusters=3, random_state=42)
clusters = kmeans.fit_predict(X_scaled)

# Adding clusters to dataframe
dados['Cluster'] = clusters

# Visualizing clusters
plt.figure(figsize=(10, 6))
sns.scatterplot(data=dados, x='R&D Spend', y='Profit', hue='Cluster', palette='viridis', s=100)
plt.title('Startup Segmentation by Cluster')
plt.xlabel('R&D Spend')
plt.ylabel('Profit')
plt.show()
Conclusions
This analysis revealed that:
- R&D investment is the most important factor for startup profit
- Marketing also has a significant impact, though less predictable
- Administrative costs have minimal correlation with profit
- Geographic location (state) doesn’t significantly impact average profit
- Predictive models can accurately forecast profit based on expense patterns
- Market segmentation identified distinct startup profiles that can guide investment strategies
For fast-growing startups, these insights are essential for:
- Setting realistic growth goals
- Optimizing resource allocation
- Prioritizing R&D and marketing investments
- Making data-driven strategic decisions
Keywords: data prediction, data modeling, Linear Regression, Bayesian Regression, Clustering, K-means, Cross-validation, Market segmentation
Tools: Python, Pandas, Scikit-learn, Seaborn, Matplotlib